Sinar Mas Multiartha
Home
Profile
Overview
Vision & Mission
Awards
Board of Commissioners
Board of Directors
Audit Committee
Internal Audit
Business
Subsidiaries Information
Technology Information
Financial Highlight
Annual Report
Financial Highlight
Financial Statement
Public Expose
Investor Relation
Share Price History
Dividend History
Shareholder Compositions
News
Corporate News
Subsidiaries News
Contact Us
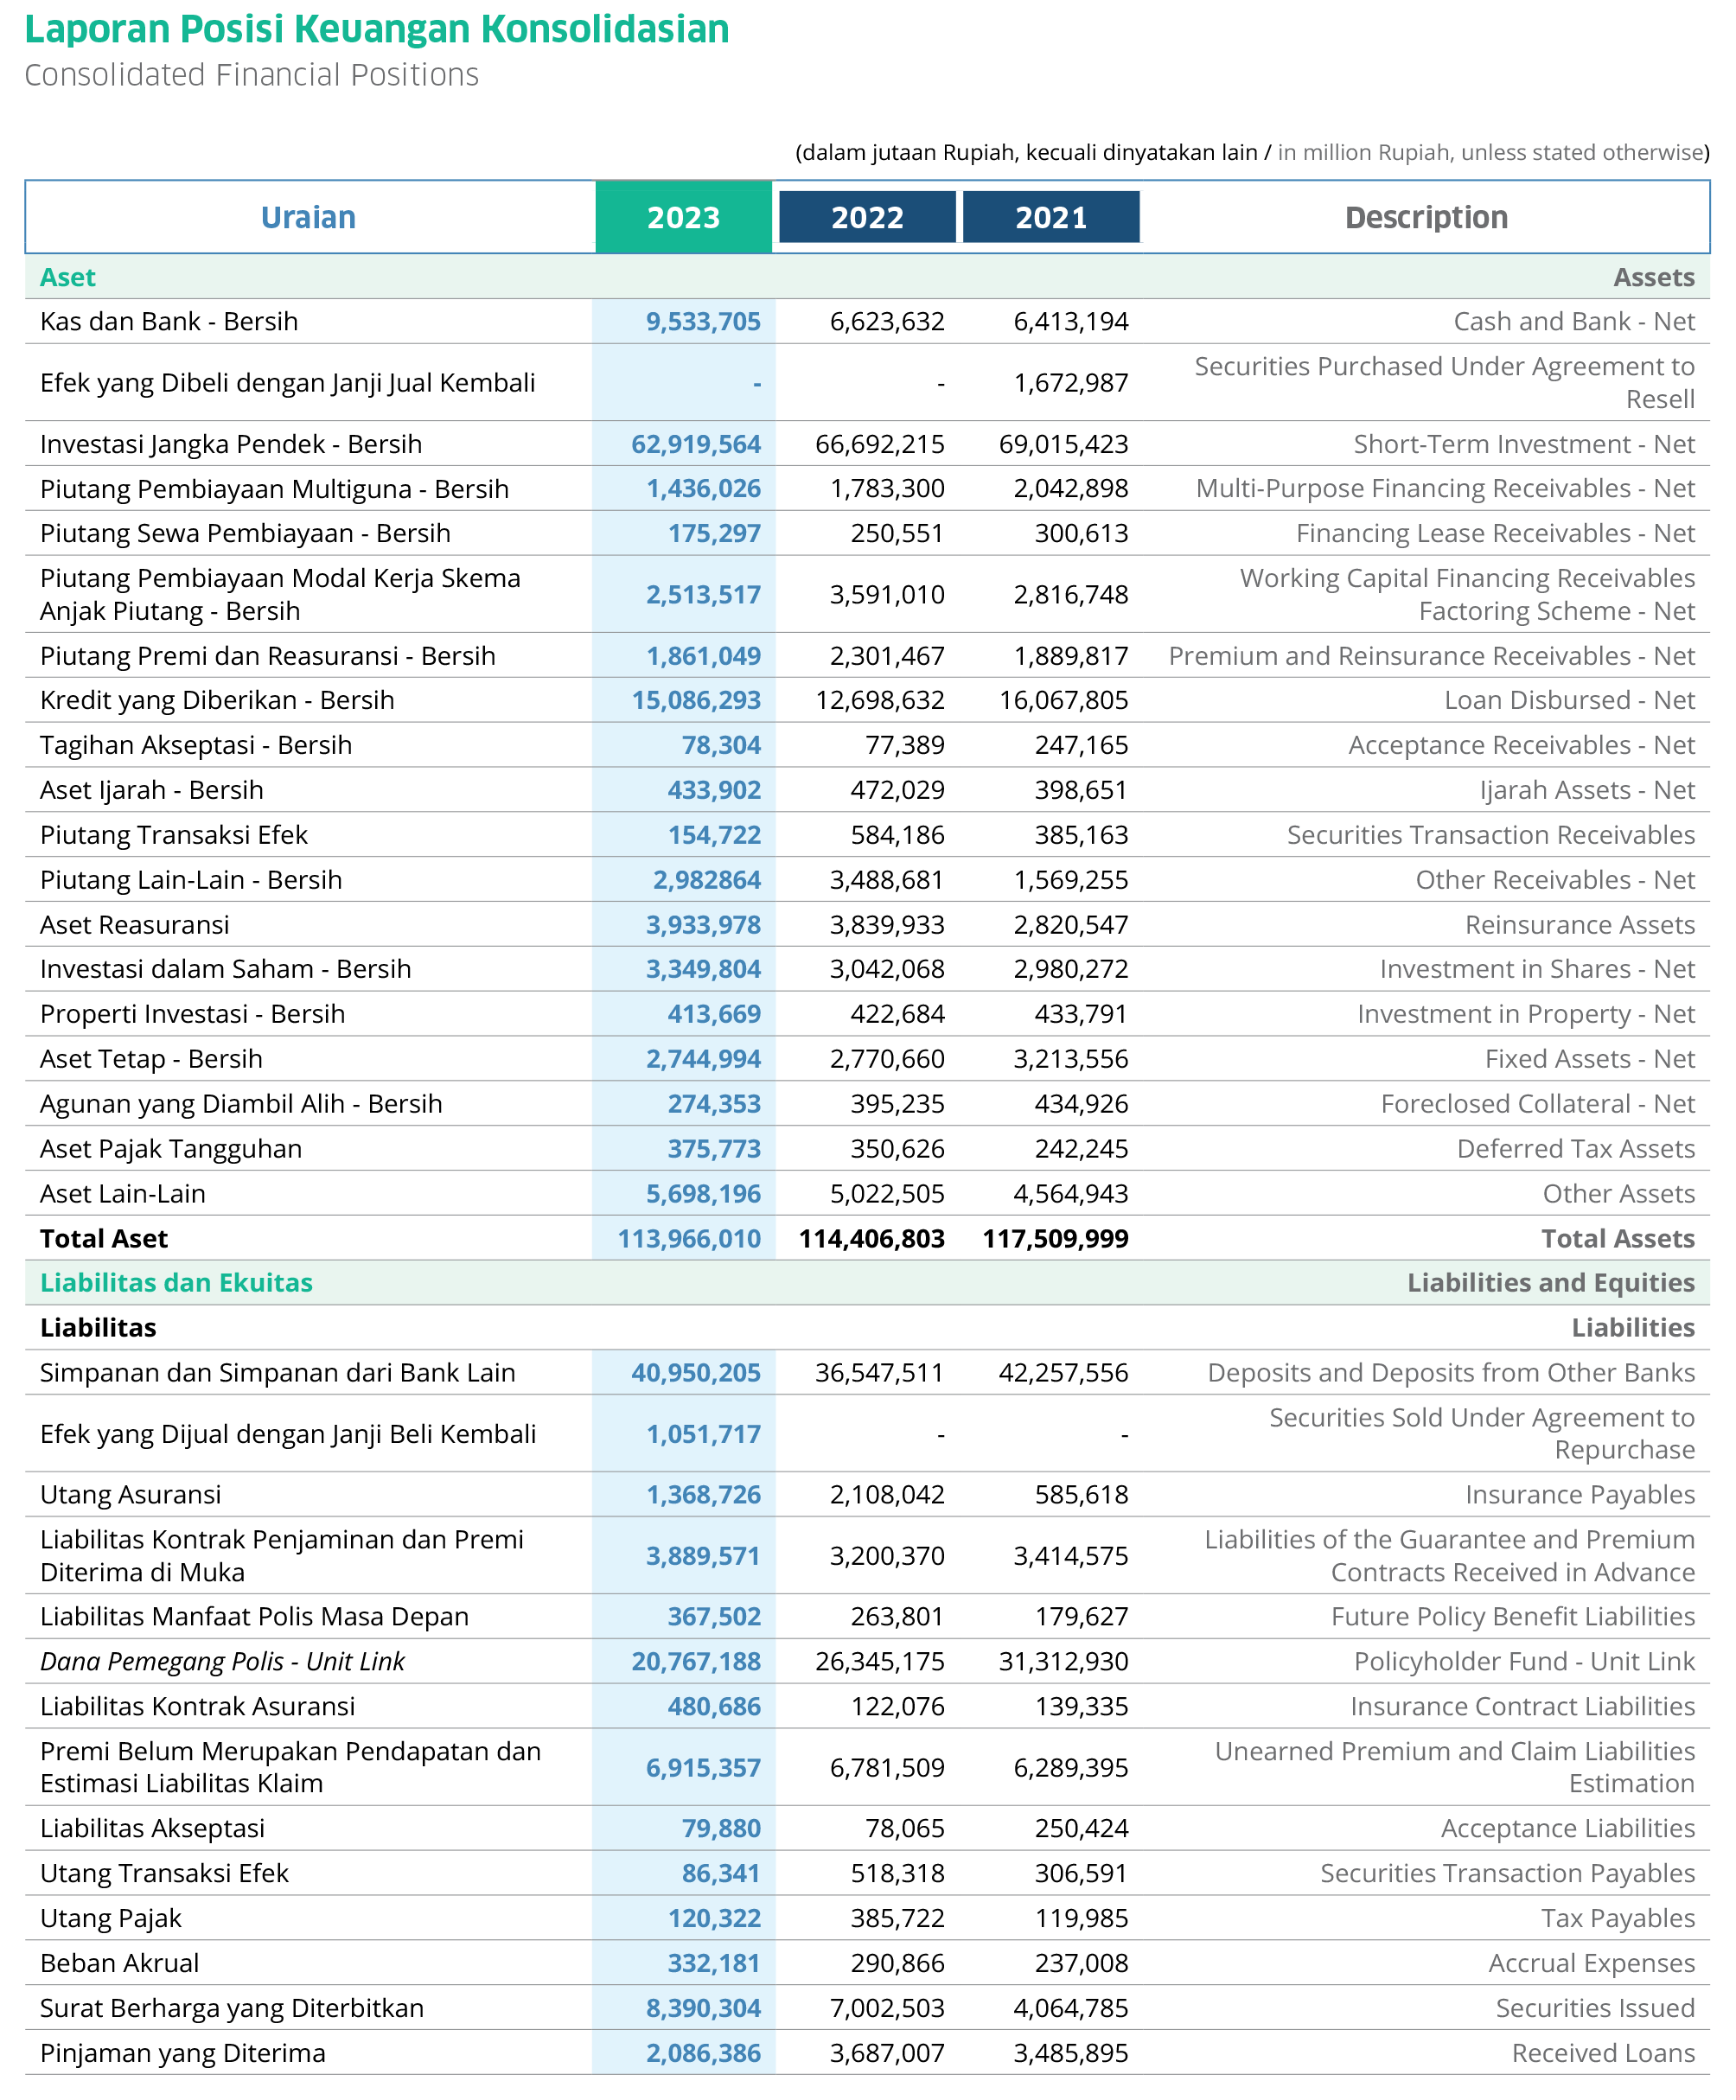
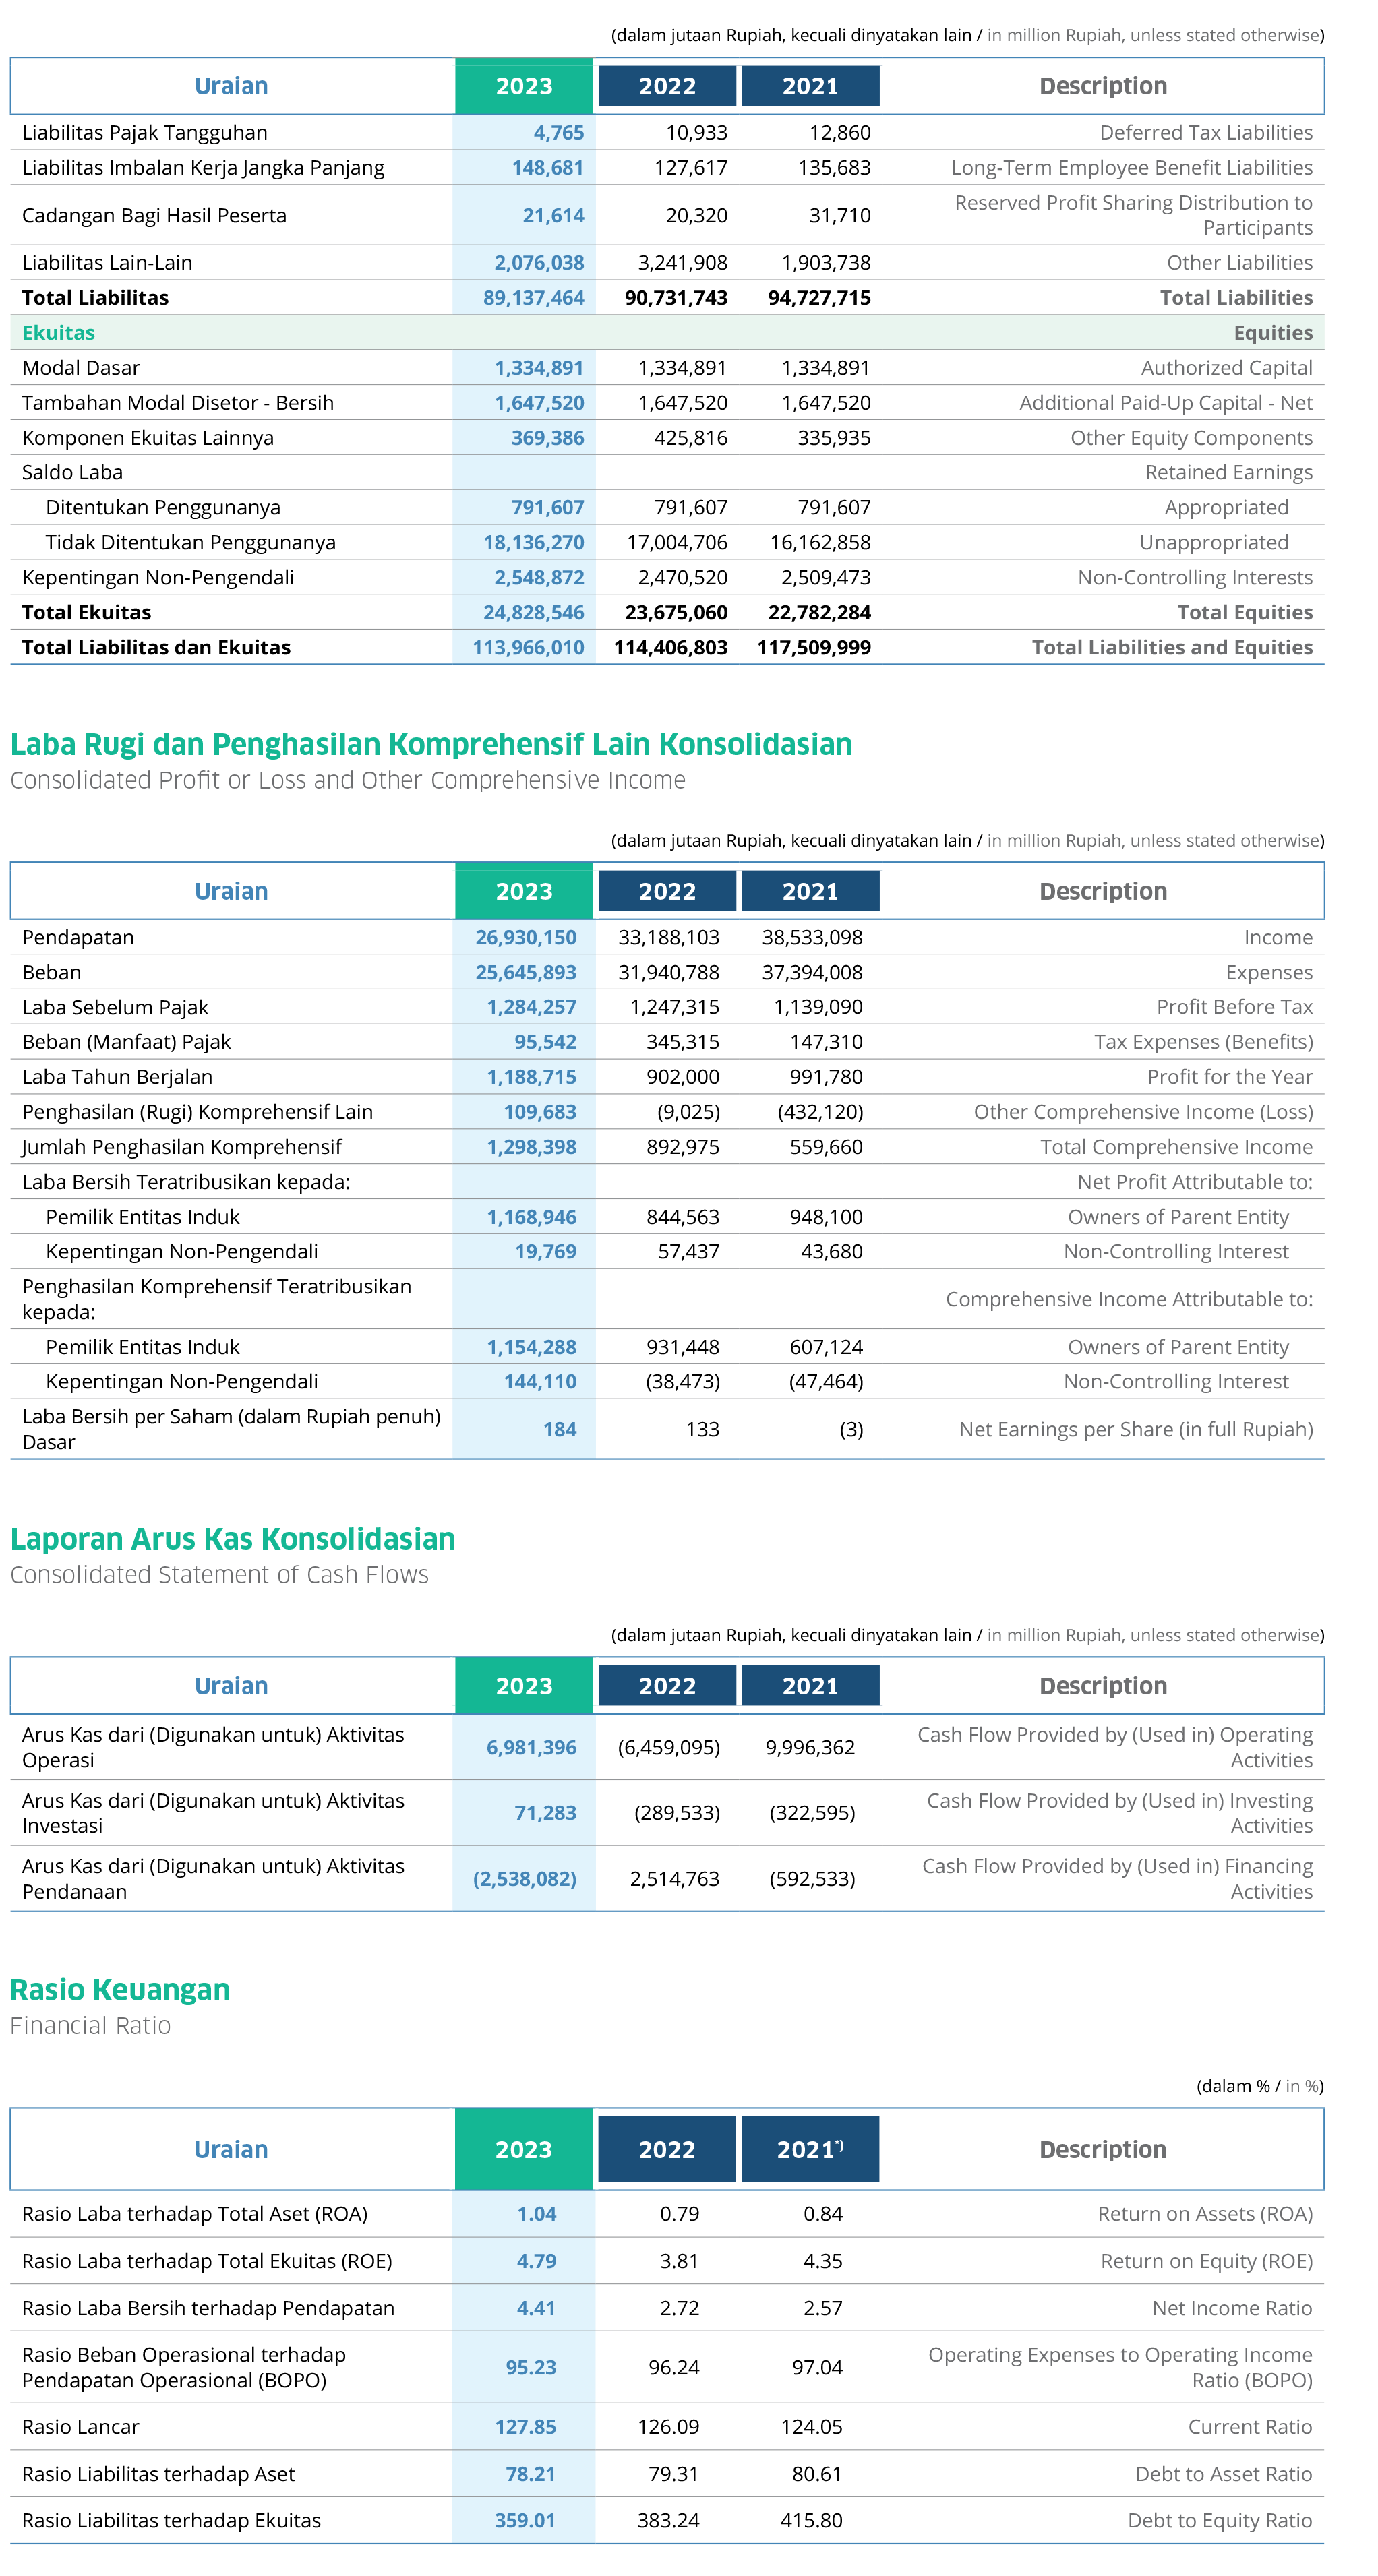
Financial Highlight


")